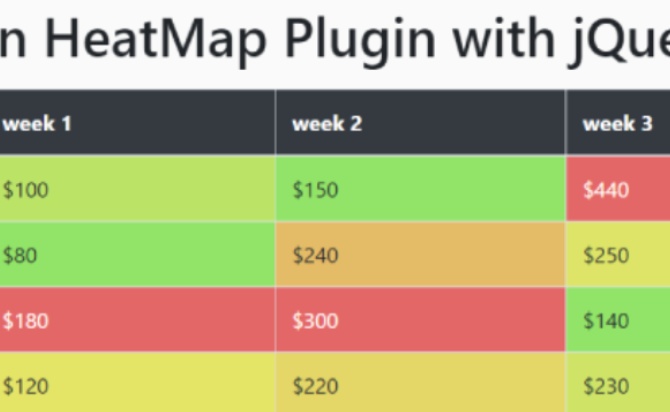
A Column heatmap is a jQuery plugin to created a power-full javaScript library, In your data table cell will appear with applying different highlight with colors to cells based on values in specific table columns. exchanged of data will reflect when your data or numeric value will change.
A jQuery plugin is used to make your data in the table looks more interesting and readable by applying different background colours to table cell based on values in specific columns.
Table of Contents
Related Plugin Links :
Table data Min/Max Highlighter Value – tableMinMax
Highlight Duplicate Value In Table Cells With jQuery Plugin – jquery-duplifer.js
How to used :
Load source with plugin.
Here we inserted source Java Scripted files into the Plugin columnHeatmap.min.js.
<script src="/jquery.slim.min.js"></script>
<script src="/columnHeatmap.js"></script>
Call with function columnHeatmap on your HTML table and column index(zero-based).
Above we wrote the code in HTML. In that code <tr> tag represents Table Row Elements, <td> tag represents Table Data, <th> tag represents Table Header. <table> tag represents Table.
<table id="yourid">
  <thead class="bg-dark text-white">
    <tr>
      <th>Month</th>
      <th>week 1</th>
      <th>week 2</th>
      <th>week 3</th>
      <th>week 4</th>
    </tr>
  </thead>
  <tbody>
    <tr>
      <td>January</td>
      <td>100°C</td>
      <td>150°C</td>
      <td>440°C</td>
      <td>350°C</td>
    </tr>
    <tr>
      <td>February</td>
      <td>80°C</td>
      <td>240°C</td>
      <td>250°C</td>
      <td>130°C</td>
    </tr>
  </tbody>
</table>
Add Script with Dynamically change the text color based on background.
Columns: Column is an Array type, and the default is [] which are compulsory. The columns that the plugin should the heap map and the first column is key 0.
Contrast: Contrast is a Boolean type, and the default value is true. It will change the colour into white if the background colour is stronger.
$('#yourid').columnHeatmap({
  columns: [1] // required
  contrast: false
});
Add Script with Revert to colors.
Inverse: Inverse is a Boolean type, and the default value is false. By default, the highest values will receive a red background colour, and the lowest value will receive a green background colour. If the value is set to true, then the logic is reserved.
$('#yourid').columnHeatmap({
  columns: [1] // required
  inverse: true
});
Add Script with Specify the starting point for HSL colors (0-360).
A colour can be specified using HSL (Hue, Saturation, and Lightness).Hue is a degree of the colour wheel from 0 to 360. Where 0 is Red Colour, 120 is Green Colour, and 240 is Blue Colour. Saturation is a percentage value, 0% us shade of gray, and 100 is the full colour.
Lightness is also a percentage value which means 0% is black, and 100% is white.
colorStartPoint: This is an Integer type value with the default value of 0. Colour offset in HSL colour, from 0 to 360.
$('#yourid').columnHeatmap({
  columns: [1] // required
  colorStartPoint: 155
});
Add Script with Control a smooth transition effect to colorized values.
Animated: this is a boolean type with default value true, and it will be fade in the background colour.
animationSpeed: This is a float type with default value .1, and it will be fade in velocity in seconds.
$('#yourid').columnHeatmap({
  columns: [1] // required
  animated: true,
  animationSpeed: .1
});
Done
Thanks for make jQuery plugin is developed by For more Helpfull for users, please check the demo page or visit the official website.


